Dashboard tour
The Dashboard (the portal home page) is your workspace at a glance: connector health, AI-client activity, subscription usage, and your MCP endpoint, all on one screen. This page walks through each section top to bottom.
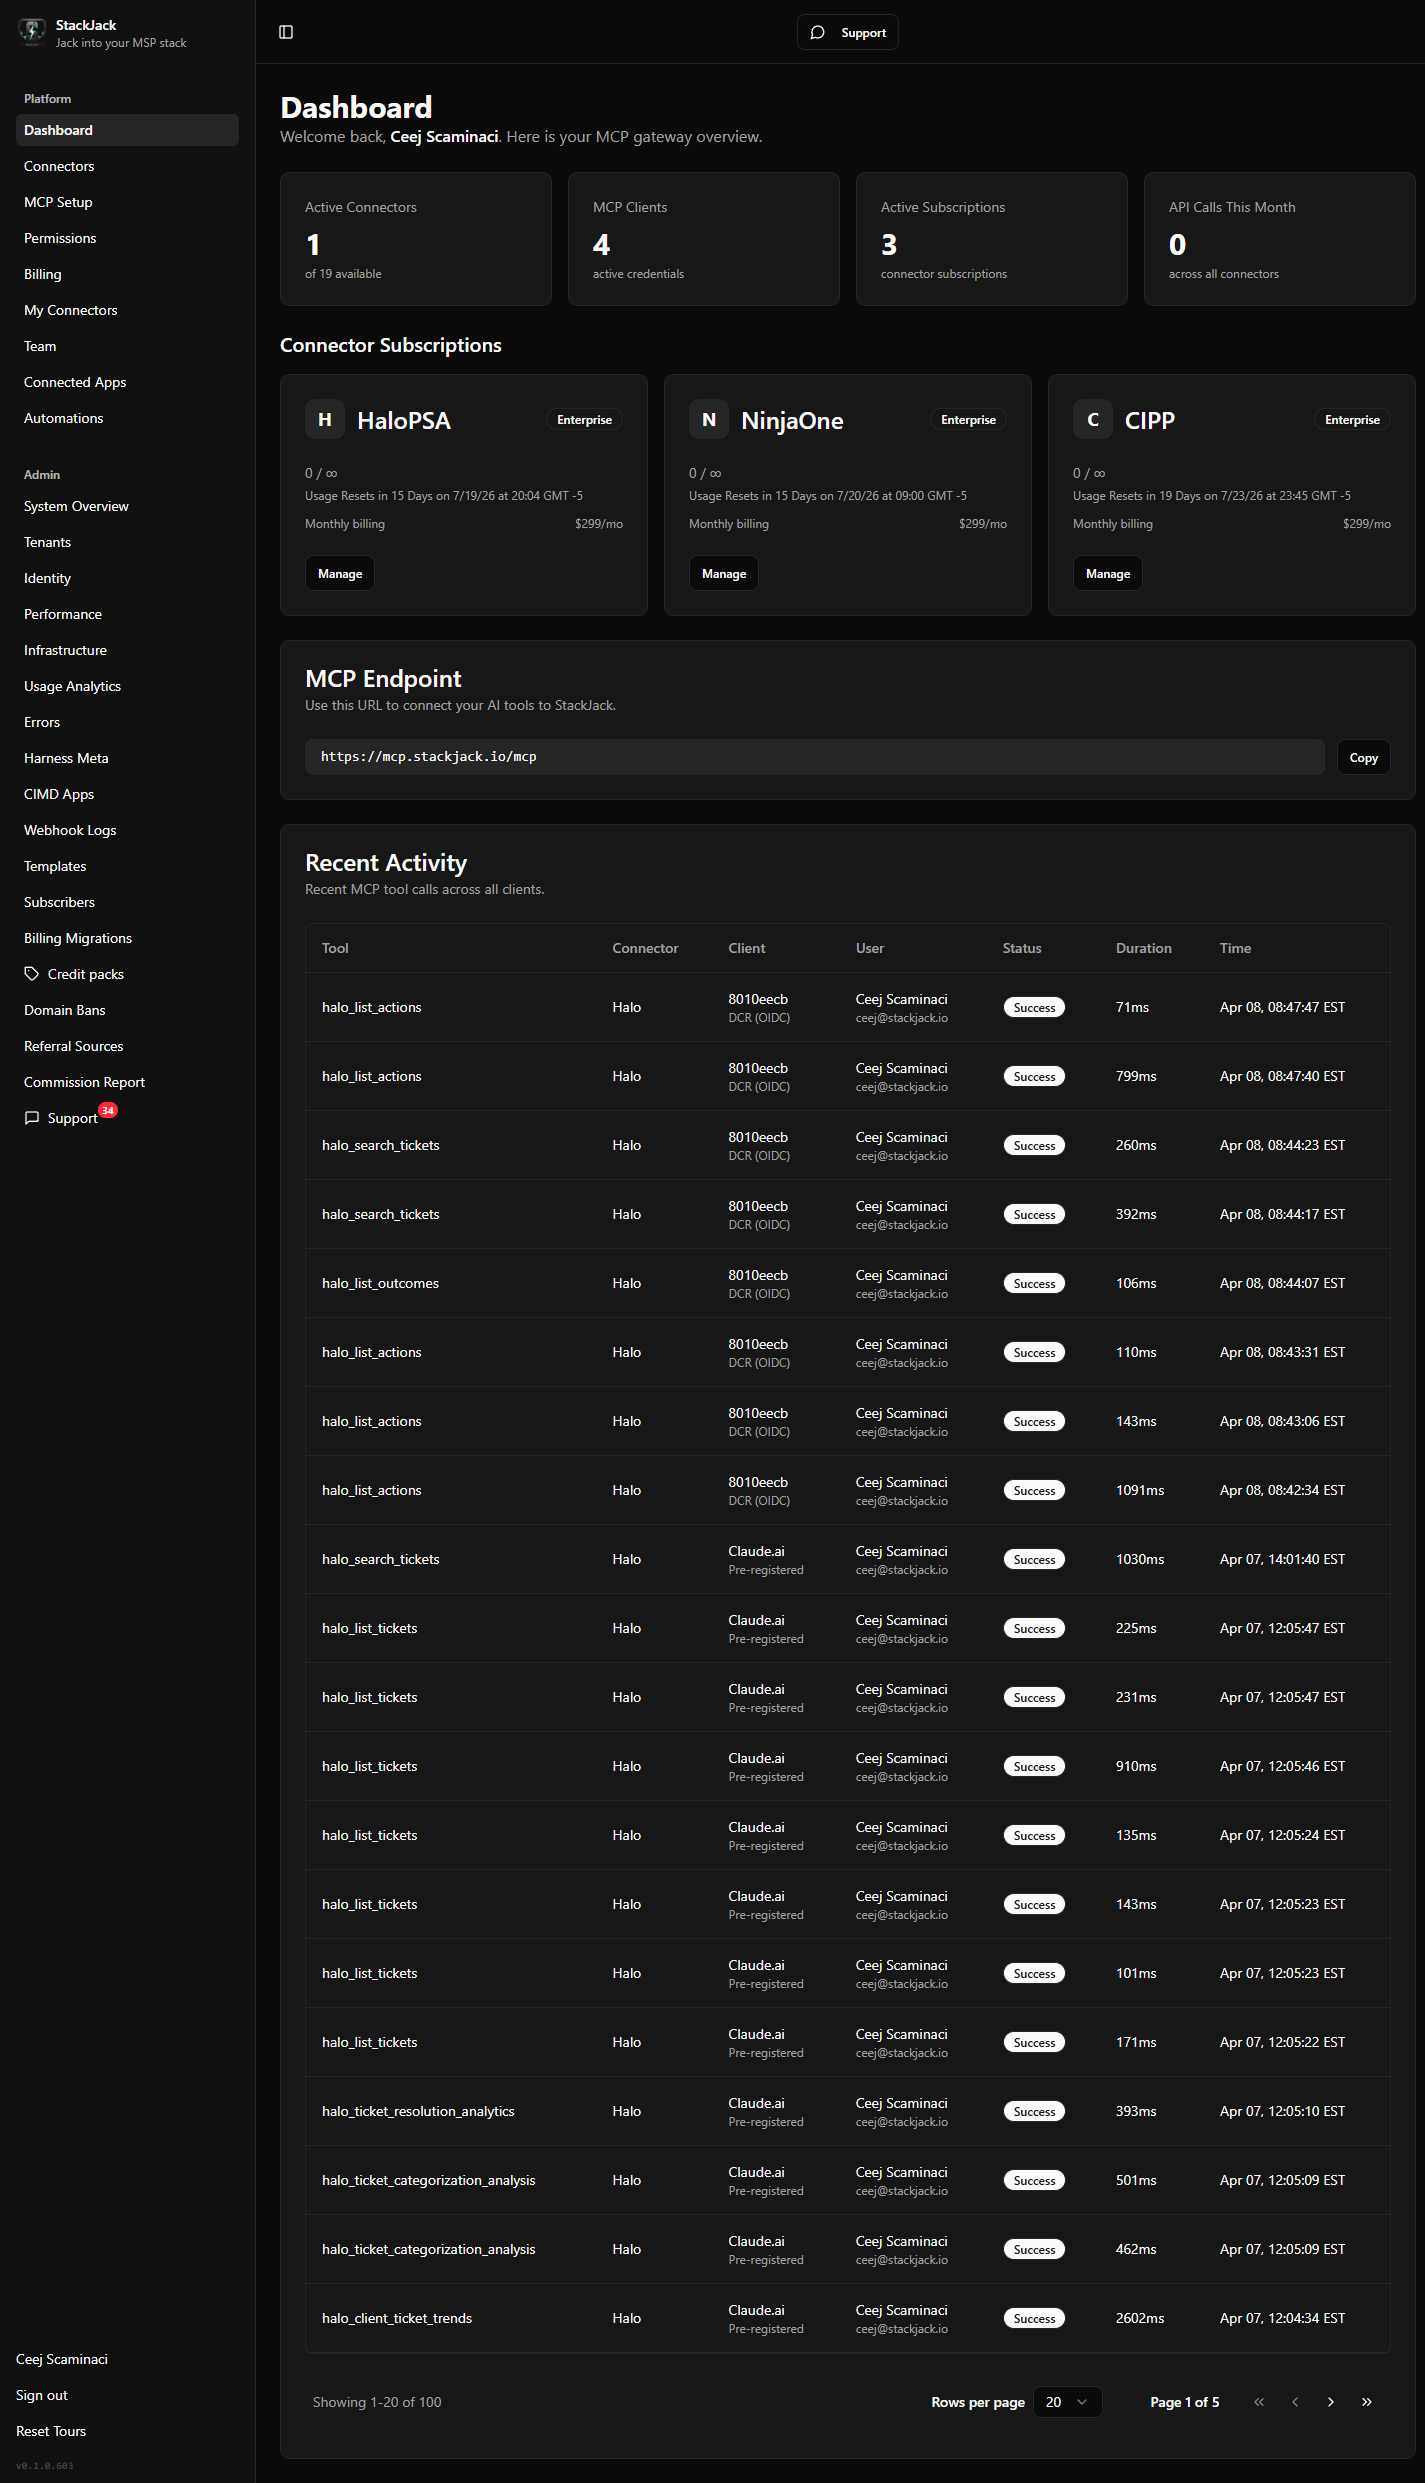 The full Dashboard for an active tenant — summary cards, subscription cards with usage bars, charts, endpoint card, and Recent Activity glance
The guided welcome tour
On your first visit (unless the setup wizard opens instead), an interactive welcome tour walks you through the portal in 8 short steps — the main navigation, the MCP endpoint, and where key pages live. Most portal pages also have their own mini-tour:
- Replay the current page's tour any time with the round ? button in the header.
- Reset Tours at the bottom of the sidebar clears all tour history so every tour (and the setup wizard, if setup is incomplete) plays again.
Summary cards
Four cards across the top, each linking to a related page:
| Card | What it shows |
|---|---|
| Active Connectors | How many of your organization's shared MSP-tool connectors are enabled, out of all supported connector types. (A connector that has been auto-disabled by credential health checks drops out of this count.) Links to the Connectors page. |
| Quota this cycle | Your combined tool-call usage against the summed monthly limit of your active subscriptions, shown as a percentage — or, when any subscription is unlimited, as a raw call total. The caption gives the combined limit and a countdown to the next cycle reset, and the tile turns amber at 80% and red at 100%. Links to the Billing page. |
| MCP Clients | How many active AI credentials (MCP clients) exist in your workspace, out of the total. Links to the MCP Setup page. |
| Connector Health | How many of your shared connectors are currently healthy — "all connectors healthy" when none need attention, otherwise "of N healthy". The tile turns amber when any connector is degraded or failing. Links to the Connectors page. |
Note the windows differ by design: the "Quota this cycle" tile and the per-subscription usage bars further down both count each subscription's own billing cycle, while the Usage Analytics charts below count the calendar month. The two can legitimately differ.
Getting started (first-run only)
Until your workspace is fully set up, the Dashboard helps you finish. Account managers see a Finish setting up StackJack checklist card that tracks the core setup steps — connect an MSP tool, connect your AI assistant, and (optional) invite your team — with a "n of 2 steps complete" count. The card auto-hides the moment your core setup is done.
Alongside the checklist, a single highlighted next-step prompt appears in place of data you don't have yet:
- Managers with no connectors: a "Get Started" alert with a Configure Connectors button that opens the setup wizard at the add-a-tool step.
- Managers with connectors but no AI connection: a Set Up MCP Connection prompt that opens the wizard at the connect-your-AI step.
- Members of a workspace that isn't set up yet: an informational note to ask their account owner.
These surfaces disappear once setup is complete.
Connector Health
Once you have at least one shared connector, a Connector Health panel shows the latest recorded status of each of your organization's shared integrations: a green/amber/red status dot per connector with a "checked Nm ago" freshness caption, and, when a connector isn't healthy, the last validation error inline. This reflects the most recent stored validation result, not a live probe — the age caption is what carries the freshness signal. Manage opens the Connectors page; per-user connector health lives there too.
Connector Subscriptions
One card per active connector plan, showing:
- Plan badge (Free / Pro / Business) and the plan's current price with your billing period.
- Usage bar for the current billing cycle: green below 80% of your monthly call limit, amber at 80% or above, red at or above 100% — plus a countdown to the cycle reset.
- Payment-status badge if the subscription needs attention (Past Due, Paused, or Canceled).
- Manage — jumps to the Billing page.
Usage Analytics
Two charts summarizing the current month:
- Top Tools This Month — which tools your AI assistants call most.
- Daily API Calls — call volume per day.
Both show an empty-state message until there is traffic.
MCP Endpoint
A card with your workspace's MCP endpoint URL and a Copy button — the same URL you paste into any AI assistant. See the MCP Setup page (sidebar: MCP Setup) for the standard and compact endpoint URLs and a link to step-by-step setup guides for each AI tool.
Recent Activity
A glance at your five most recent tool calls. Each row shows:
- The tool name that was called (for example a ticket-search tool).
- Its connector and the AI client (MCP client) that made the call.
- A green or red dot indicating success or error.
- The time it ran, shown in Eastern Time.
For the full history — browsing further back with filtering, sorting, and CSV export — use the View all in Audit Logs button, which opens the Audit Logs page (/audit).
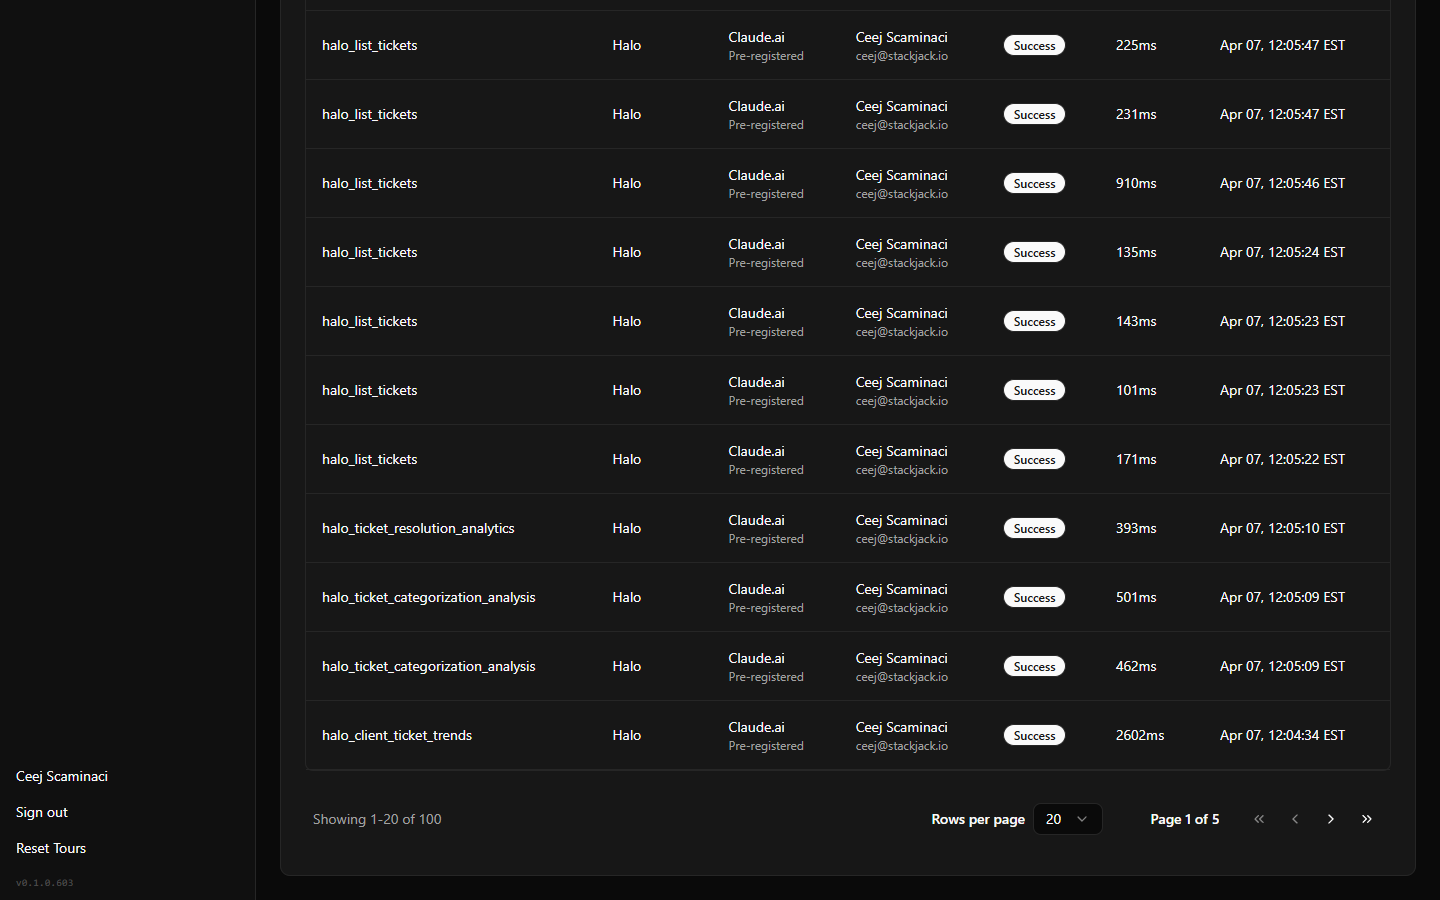 The Recent Activity glance with a mix of Success and Error rows and per-user attribution
If the Dashboard doesn't load
- Loading skeletons are normal for a moment on entry.
- A full-page restricted access panel (with a support code) means your sign-in worked but your workspace access needs attention — see Your first sign-in.
- A "Temporary Load Failure" warning means the workspace data could not be fetched just now — reload the page; contact support if it persists.